Why the 200-week moving average matters
Every Bitcoin cycle produces the same debate: is this dip a discount or the start of something worse? Price action alone rarely answers that question. The 200-week moving average often does.
The 200-week MA is Bitcoin's slowest, most stubborn trend line. It smooths out four years of price data, roughly one full halving cycle, which is exactly why long-term investors watch it. In previous bear markets, price has historically found major buying interest around this level. It is not magic and it is not a guarantee, but it is the closest thing Bitcoin has to a long-term valuation anchor.
When price trades far above it, you are paying a premium for momentum. When price comes back down to meet it, history suggests you are being offered a discount that rarely stays on the table for long.
The setup right now
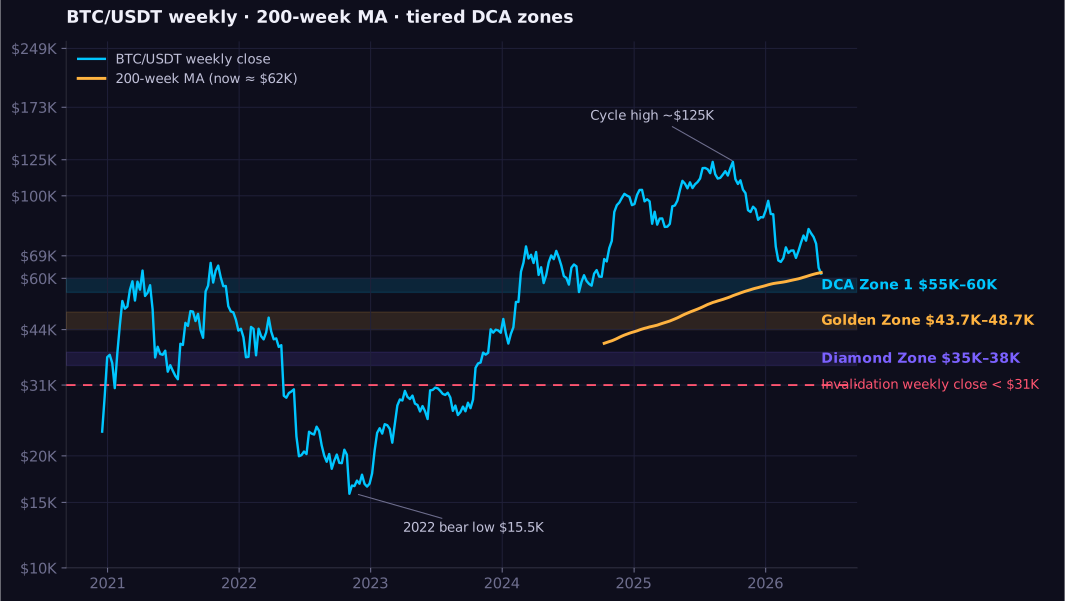
Bitcoin has pulled back from its cycle high near $125K and is now retesting prior structure around $60K. That level matters for three reasons. It sits on the old $69K breakout area, which has flipped from resistance to support. The 200-week moving average currently sits near $62K, and price is trading right on it. And it lands in the 0.618 Fibonacci retracement zone of the entire advance from the 2022 low ($15.5K) to the cycle high ($125K), which falls at roughly $57K.
This is exactly the kind of environment where investors make their worst decisions. Some panic-sell into support. Others go all-in trying to nail the exact bottom. Both approaches bet everything on precision that nobody actually has.
My answer is a dollar-cost-averaging plan: stagger buys across tiered zones and let the average price do the work.
The accumulation zones
DCA Zone 1 ($55K to $60K). Price is here now, resting on the old breakout level and the long-term MA. This is the first tranche, so start scaling in. Lighter buys, no hero sizing.
Golden Zone ($43.7K to $48.7K). The high-conviction band into deeper demand. This lines up with a deeper retracement into prior demand and the rising long-term MA. Heaviest buys go here.
Diamond Zone ($35K to $38K). The deep-discount flush. I am keeping 20% of capital in reserve specifically for this zone. If we get here, back up the truck.
The logic is simple: lighter buys up high, heavier buys down low, and dry powder held back for the extreme. A deeper flush does not catch you out of capital, and a V-shaped reversal does not leave you on the sidelines.
Where the zones come from: Fibonacci confluence
These zones are not round numbers pulled from the air. Measure the full advance from the 2022 bear low at $15,476 to the cycle high near $125K, and the classic retracement levels land almost exactly on them:
- 0.618 retracement ($57.3K) falls inside DCA Zone 1, right where the rising 200-week MA (now ~$62K) is meeting price
- 0.702 retracement ($48.1K) marks the top of the Golden Zone
- 0.786 retracement ($38.9K) sits on the shelf directly above the Diamond Zone
When a Fibonacci level, a prior breakout area, and the 200-week moving average stack on top of each other, that is confluence. It does not guarantee a bounce, but it tells you where the market has the strongest historical reasons to care.
Upside targets, mapped to Fibonacci extensions
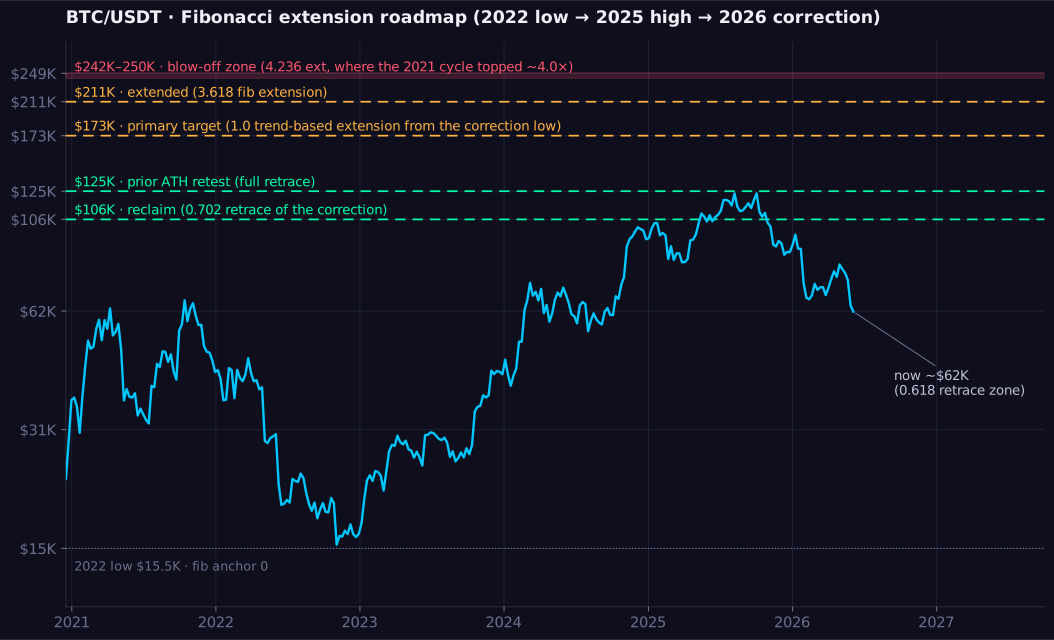
If the accumulation thesis plays out, the targets are not arbitrary either. Each one corresponds to a measurable extension level:
- $106K reclaim of the breakdown level, the 0.702 retracement of this correction ($125K down to ~$62K)
- $125K retest of the previous all-time high, the full retrace
- $173K primary cycle target, the 1.0 trend-based extension: the size of the entire 2022-to-2025 advance projected upward from the correction low
- $211K extended target, the 3.618 Fibonacci extension of the 2022 bear decline ($69K down to $15.5K), which projects to roughly $209K
- $242K to $250K blow-off zone, anchored on the 4.236 extension (~$242K), with $249K as the outer edge
What past cycles say about the blow-off
The 4.236 ratio is not pulled from a hat. In the last cycle, Bitcoin's 2021 top at $69K landed at a 3.98 extension of the 2018 bear decline ($19.7K down to $3.1K), a near-perfect tag of the same Fibonacci band. Apply the identical measurement to this cycle's bear decline and the 4.236 extension projects to roughly $242K. That is the basis for the $240K to $250K blow-off zone.
One honest caveat. Each cycle top has been a smaller multiple of the previous all-time high: 2017 topped at roughly 17x the 2013 high, 2021 at about 3.5x the 2017 high, and $125K was only 1.8x of $69K. A move to $249K would be 3.6x, cutting against that diminishing-returns pattern. That is exactly why $173K is the primary target and the blow-off zone is the stretch scenario, not the base case.
Plan the exits before the euphoria, not during it. Targets defined in a calm market are worth far more than targets improvised in a euphoric one.
Invalidation
Every plan needs a line where it admits it is wrong. For this one: a weekly close below $31K breaks the structure. That would mean losing the Diamond Zone, the long-term MA, and the multi-year support shelf beneath it. At that point the bullish thesis is not "early," it is invalid, and the entire ladder gets reassessed.
Defining invalidation in advance is what separates a plan from a hope.
Why DCA beats bottom-picking
Nobody buys the exact bottom except liars and lottery winners. The bottom is only visible in hindsight, and waiting for certainty means paying 30% more for it.
Tiered DCA accepts that uncertainty instead of pretending it away. You buy more as the discount deepens, you keep reserves for the extreme scenario, and you define the price where you walk away. Patience over precision. Accumulate the zones, plan the exits, and ignore the noise.
*This is my personal plan, not financial advice. Do your own research and manage your own risk.*